My first (official) month in the Solidverse

or how to start a new chapter of your life

In this post, I report on how it was to start a new chapter of my life, what I did and how it felt. For a technical take on the Solidverse, there will be a follow-up post.

First things first, why a new chapter?

Job hunting usually triggers a new chapter, doesn’t it? I started looking for a job in the domain of Semantic Web. I send in a CV at Inrupt even though there was no open positions. The whole process took about 3 months. This gave me enough time to consider if I should accept the position offered to me or not. The reason why it took so long is related to the hiring process and my struggle to come back after what felt like a startup failure (read about My year of entrepreneurship).

Why Solid?

I very much agree with what the Solid Project website says: “your data your choice”. It is my first job where we all work for a greater purpose bigger than just revenue. The point is: the future is still so much bigger when it comes to the world wide web. Sir Tim Berners-Lee and the Inrupt team are spearheading a new technology, Solid, which empowers individuals and opens new value creation opportunities. Instead of waiting for the future to happen, I decided I want to be part of shaping it. I got a position as a Software Engineer on the open-source SolidOS project guided by Sir Tim Berners-Lee.

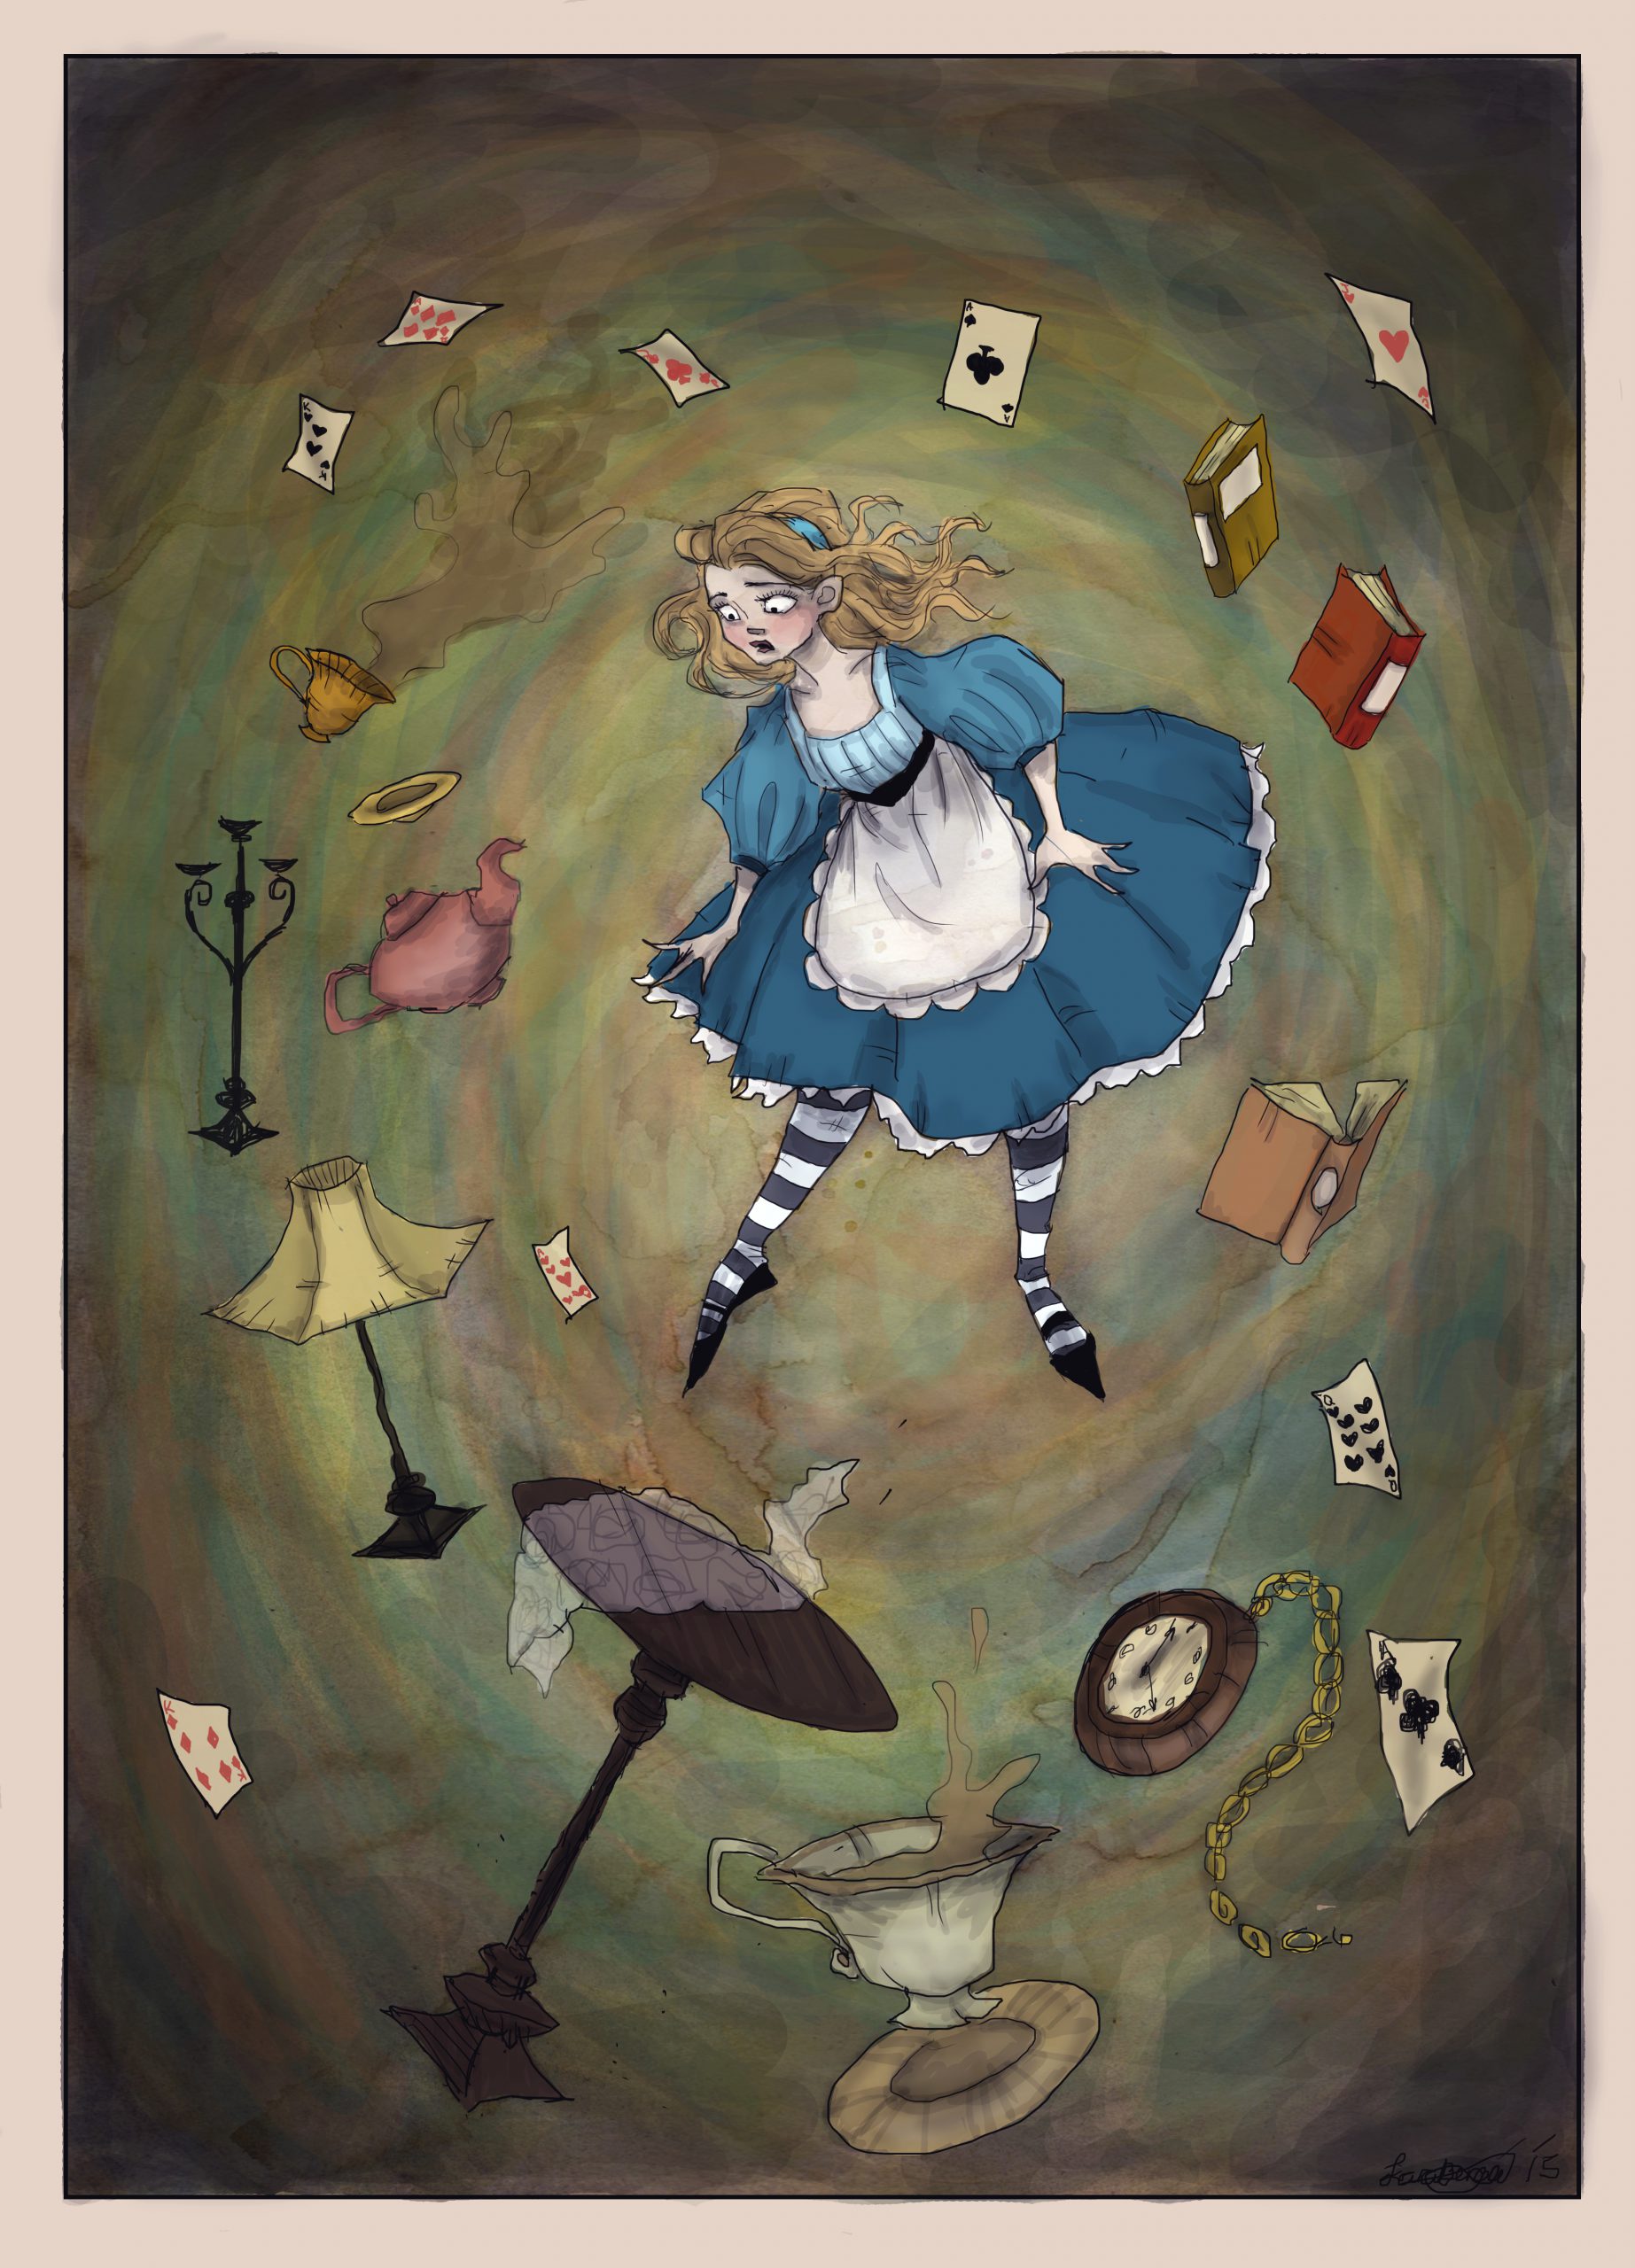
Down the rabbit hole

Everything was new… and it felt like a tremendous change. Who is not scared, a bit, by change?

The start

Inrupt is a startup and one needs to get useful. In startups, getting told what to work on is not the norm. So I started with writing my job description. This was the first exercise where I needed to think about how to do my job and what I want to work towards. Being 10 years in the industry did help! Typically, for me, the plan goes as follows:

  • First month and a half: acquire knowledge about code, processes, and people.
  • Following months kick-off/embed yourself in a feature/sub-project where you think you can contribute. Then focus to deliver.

There were a lot of new things for me: new programming language, new development environment, new OS, new laptop, new working culture (all remote), different timezones, open-source, new ecosystem, new people, new chat applications, new processes, new autonomy in a company, new hair color 😏. The only thing that stayed the same was my desk at home, luckily 😅 (which changed already a month before). And the fact that I already know Semantic Web.

The first official week, I felt overwhelmed by the autonomy I have. This is not for everyone! I was a bit spinning I gotta admit, the first day before I anchored myself in my usual fallback solution: create a todo list 😎. Spinning for me means: fussing around being unfocused, not knowing what to do because either there are too many tasks or because one does not know how to start, on the what to focus. A todo list always helps me. What is your fallback solution?

The second week, I started to feel a burdening imposter syndrome. You know, the feeling which we all have when we are new to something. It is the feeling of being discovered as a no-good and fired on the spot 😱. I suppose it was all normal especially because my environment involves working with people with a lot of experience from high-profile companies. Or people with years of business and developer experience. And, well, there was the ‘creator of the web boss’ things which, I gotta admit, was intimidating at first. However, reality is nothing like that.

If you ever had impostor syndrome you know what I mean 🥺. I got over it because the people I work with are just amazing, supportive, and understanding. They told me about their impostor syndrome and I did not feel judged, for a second, for my experience, background, culture, gender, and so on. And that right there made all the difference!

The middle

Compared to my previous times of starting a new job, I did not focus only on reading and learning. Instead, I decided to bang my head by taking on a code feature and work it out. Bang my head means: write code before reading the entire documentation or knowing the entire code architecture or whatever.

My new approach was so much fun!!! It worked because:

  • My reading and learning focused on basics that helped me be productive – building code with node, javascript basics, npm packaging, visual studio code shortcuts.
  • I know how to ‘divide and conquer’ a task, split it into subtasks and achieve small goals.
  • I got great feedback on the way, through pull requests.
  • And most AWESOME: I got a buddy who introduced me to SolidOS code, to the communication, and to the people (thank you Sharon!).

And what do you know: I did my first Pull Requests on open source, I learned a ton about the code, and I found tasks where I can be useful moving forward.

Towards the end of the month, I felt more on top of the code stack and I could focus again on what I wanted/needed to do after the learning phase.

  • Slowly, I started to gather information about a new feature I want to kick off.
  • Talked to/found people who can help me implement it.
  • Exchanged some ideas and wrote up a bit of documentation.

The productive

What helped me go from getting started to be productive in a nutshell:

  • Have a buddy or ask for one.
  • Have a plan in place like 1.5 months learn then kick off smth.
  • Don’t get demoralized that one is not productive in the first month when only learning should be the goal – make a post-it if you forget “learning is the goal”.
  • Start learning about tech stack parts that make you productive – set up the environment, know how to build, use watch, and so on.
  • Lean on colleagues to help with overcoming impostor syndrome and not feeling like the new person – proactively plan coffee chats.
  • Divide and conquer every task – don’t get stuck in being overwhelmed by how big a task is and feel the ‘done’ effect when a small part has been achieved.
  • Talk to people and listen.

And most important:

  • Be kind to yourself in the process of change! Accept that you will have bad days and non productive days and days where not much will work. ‘Those too shall pass”.

The beautiful part about it was that even though I went in this endeavor with low energy, I did not get lost in stress but through kindness and patience, I was more productive than I thought I could be.

What’s next

Now I am off to my last MBA course (on leadership) so I can close that chapter of my life too. I am careful lately about my energy level and try to finish a project before starting new big ones. The startup year exhausted me there 😓.

Regarding Solid, oh!, I have so many cool things I want to do. The Solidverse captivated me completely! I felt welcomed and useful and valued. I am off to a great new chapter of my life, full of code and creativity, and collaborative work!

A cross-RDF Graph Database investigation: the case of the missing context!

What is a graph in RDF?

RDF Graph Databases, also known as Triplestores, are a subset of Graph Databases where data is represented in triples. A simple triple consists of a subject, a predicate and an object aka subject-predicate-object. The predicate is the edge in the data graph that connects the subject to the object nodes. If we add context or graph information to a triple, we end up having the following structure: graph-subject-predicate-object. And when we talk about a graph in an RDF Graph Database, we always refer to it as the context. This type of triple, in turn, is named a quad.

The graph exists to structure and represent your data better because the triples with the same graph have the same context. The existence of the graph is one of the main differences between a property graph database and an RDF graph database. Yes, you can store your graph information in a property graph database too, but the RDF store is designed from the ground up with this in mind.

In the end, the choice of the database type is a matter of performance and how you want your data to be represented best for your use case.

What happens if there is no graph? 

One can insert data in the RDF Graph Database that does not contain the graph information. These simple triples are stored in the so called “unnamed graph” or “default graph” of the database. We want to see how to access this graph and we know that the DEFAULT SPARQL keyword is usually used in such cases.

Now that we specified what the DEFAULT graph is in relation to an RDF Graph Database, we will take a look at different triplestores and their specific implementation of it. We will look at some basic actions like data insert, delete and query. 

The triplestores we evaluated are: RDF4J 2.4, Stardog 6.1.1, GraphDB 8.8, Virtuoso  v7.2.2.1, AllegroGraph  6.4.6, MarkLogic 9.0, Apache JENA TDB, Oracle Spatial and Graph 18c. From now on when we mention one of them, we refer to the versions listed here. We did not change any configurations upon installation, so our observations relate to the default setup. 

Learnings

Data insert observations

The insert data SPARQL query used is

INSERT DATA {

<http://example.org/picasso> <http://example.org/paints> <http://example.org/guernica>

}

This query inserts a triple which has to graph information. The triple is stored in the DEFAULT graph of each RDF Graph Database. However there is a difference from store to store of what the DEFAULT graph represents. 

In Stardog, the DEFAULT graph keywords does not exist and instead one needs to use <tag:stardog:api:context:default>. All triples land here. 

Apache JENA TDB uses <urn:x-arq:DefaultGraph\> as default graph and the triples land here. You can use the DEFAULT keyword to query them.

Virtuoso has an internal default graph but the big difference is that a user cannot access it by using the DEFAULT keyword. The triples without graph information are added to this internal default graph.

Select data observations

The SPARQL query for selecting data used is:

SELECT * WHERE {

?s ?p ?o

}

For most of the triplestores what happens is that the data retrieved is coming from all graphs, including the DEFAULT graph. Basically it does not take into account any specific graph. The exceptions are:

Stradog retrieves data only from its internal default graph <tag:stardog:api:context:default>.

For Virtuoso you always need a graph otherwise you receive: “No default graph specified in the preamble”.

Delete data observations

The SPARQL query used to delete a triple is:

DELETE {

?s ?p ?o

} WHERE {

<http://example.org/picasso> <http://example.org/paints> ?o

}

Generally the triples that match the pattern are deleted from ALL graphs it exist in. Exceptions from this behaviour we found in:

Stradog deletes the triple only in the defined default graph. 

MarkLogic and Apache JENA TDB behaves the same. It deletes the triples that match the pattern only from the internal default graph. 

In Virtuoso one always needs to specify a graph to delete data. 

We also want to remark how a SPARQL query looks like when the DEFAULT keyword is present. The query to select data would look like:

SELECT * FROM DEFAULT WHERE {

?s ?p ?o

}

Additional known configurations 

In Stardog there is a configuration property which lets you choose which behaviour you like better. Through the query.all.graphs = true parameter, when you query without a graph, it will look in all graphs – default and named graphs – exactly like in the case of RDF4J. And if the property is set to false, it will only query the internal default graph. 

Additionally, if for some reason, you really need a graph in your SPARQL query even when you only need data from the DEFAULT graph, in Stardog you can write it as: FROM <tag:stardog:api:context:default>. And if you want to query all graphs, you can also do FROM <tag:stardog:api:context:all>.

In Virtuoso we learned that you always need to specify a graph when you query. So how do we work with the DEFAULT graph than?

There is a specific syntax for Virtuoso which lets you define/set your graph at the beginning of the query:

define input:default-graph-uri <graph_name>

INSERT DATA

{<http://example.org/picasso> <http://example.org/paints> <http://example.org/guernica>

}

Read more about it in the Virtuoso documentation.

AllegroGraph also provides some configurations. The defaultDatasetBehavior can be used directly in the SPARQL query to determine if  :all, :default or :rdf should be used when no graphs name is specified in the query. 

Or one can fix the default graph name with the default-graph-uris option (or the default-dataset-behavior) upon the run-sparql command.

In MarkLogic when working with REST or XQuery one has the default-graph-uri and a named-graph-uri parameters available, like mentioned in the SPARQL 1.1 Protocol recommendation to specify the graph.

In Apache JENA TDB all named graphs can be called  with <urn:x-arq:UnionGraph>. The configuration parameter tdb:unionDefaultGraph can be added to switch the default graph to the union of all graphs. And the default graph can be specifically called with <urn:x-arq:DefaultGraph\>

Conclusion

RDF Graph Databases are built from the group up with the context of your data in mind. Knowing your graphs and triplestore setup is, from my point of view, a basic knowledge for both developers but also data engineers. Always start with the question: “what setup do I need for my use case?”

Cross-RDF Graph Database behavior – the DEFAULT graph 

Triple store behavior on new installWRITE triples without graphSELECT triple without graphDELETE triple without graph
RDF4J 2.4Triples are added to DEFAULT graph.Retrieves data from ALL graphs including the DEFAULT graph.Deletes triples that match the pattern, from ALL graphs.
Stardog 6.1.1Triples are added to <tag:stardog:api:context:default>  graph which acts as the DEFAULT graph.It retrieves data only from the <tag:stardog:api:context:default> graph.It tries to delete the triple in the defined default graph. 
AllegroGraph  6.4.6Triples are added to an internal DEFAULT graph.Retrieves data from ALL graphs including the DEFAULT graph.Deletes triples that match the pattern, from ALL graphs.
MarkLogic 9.0Triples are added to an internal DEFAULT graph.Retrieves data from ALL graphs including the DEFAULT graph.It tries to delete the data in the internal DEFAULT graph.
GraphDB 8.8Triples are added to DEFAULT graph.Retrieves data from ALL graphs including the DEFAULT graph. Deletes triples that match the pattern, from ALL graphs.
Virtuoso v7.2.2.1Triples are added to an internal DEFAULT graph.You always need a graph otherwise you receive: “No default graph specified in the preamble”You always need to specify a graph to delete data.
Apache JENA TDBTriples are added to <urn:x-arq:DefaultGraph\>  graph which acts as the DEFAULT graph.It retrieves data only from the <urn:x-arq:DefaultGraph\> graph.It tries to delete the triple in the specified default graph. 
Oracle Spatial and Graph 18cTriples are added to an internal DEFAULT graph.Retrieves data from ALL graphs including the DEFAULT graph.Deletes triples that match the pattern, from ALL graphs.
Triple store behavior on new installWRITE triples without graphSELECT triple without graphDELETE triple without graph

Ready to connect to the Semantic Web – now what?

As an open data fan or as someone who is just looking to learn how to publish data on the Web and distribute it through the Semantic Web you will be facing the question “How to describe the dataset that I want to publish?” The same question is asked also by people who apply for a publicly funded project at the European Commission and want to have a Data Management plan. Next we are going to discuss possibilities which help describe the dataset to be published.

The goal of publishing the data should be to make it available for access or download and to make it interoperable. One of the big benefits is to make the data available for software applications which in turn means the datasets have to be machine-readable. From the perspective of a software developer some additional information than just name, author, owner, date… would be helpful:

  • the condition for re-use (rights, licenses)
  • the specific coverage of the dataset (type of data, thematic coverage, geographic coverage)
  • technical specifications to retrieve and parse an instance (a distribution) of the dataset (format, protocol)
  • the features/dimensions covered by the dataset (temperature, time, salinity, gene, coordinates)
  • the semantics of the features/dimensions (unit of measure, time granularity, syntax, reference taxonomies)

To describe a dataset the best is always to look first at existing standards and existing vocabularies. The answer is not found looking only at one vocabulary but at several.

Data Catalog Vocabulary (DCAT)

DCAT is an RDF Schema vocabulary for representing data catalogs. It is an RDF vocabulary for describing any dataset, which can be standalone or part of a catalog.

Vocabulary of Interlinked Datasets (VoID)

VoID is an RDF vocabulary, and a set of instructions, that enable the discovery and usage of linked data sets. VOID is an RDF vocabulary for expressing metadata about RDF datasets.

Data Cube vocabulary

Data Cube vocabulary is focused purely on the publication of multi-dimensional data on the web. It is an RDF vocabulary for describing statistical datasets.

Asset Description Metadata Schema (ADMS)

ADMS is a W3C standard developed in 2013 and is a profile of DCAT, used to describe semantic assets.

You will find only partial answers of how to describe your dataset in existing vocabularies while some aspects are missing or complicated to express.

  1. Type of data – there is no specific property for the type of data covered in a dataset. This value should be machine readable which means it should be standardized, possibly to an URI which can be de-reference-able to a thing. And this ‘thing’ should be part of an authority list/taxonomy which is not existing yet. However one can use the adms:representationTechnique, which gives more information about the format in which a dataset is released. This points only to dcterms:format and dcat:mediaType.
  2. Technical properties like – format, protocol etc.
    There is no property for protocol and again these values should be machine-readable, standardized possibly to an URI.
    VoID can help with the protocol metadata but only for RDF datasets: dataDump, sparqlEndpoint.
  3. Dimensions of a dataset.
    • SDMX defines a dimension as “A statistical concept used, in combination with other statistical concepts, to identify a statistical series or single observations.” Dimensions in a dataset can therefore be called features, predictors, or variables (depending on the domain). One can use dc:conformsTo and use a dc:Standard if the dataset dimensions can be defined by a formalized standard. Otherwise statistical vocabularies can help with this aspect which can become quite complex. One can use the Data Cube vocabulary specifically qd:DimensionProperty, qd:AttributeProperty, qd:MeasureProperty, qd:CodedProperty in combination with skos:Concept and sdmx:ConceptRole.Data Cube
  4. Data provenance – there is the dc:source that can be used at dataset level but there is no solution if we want to specify the source at data record level.

In the end one needs to combine different vocabularies to best describe a dataset.

Add a dataset

The tools out there used for helping in publishing data seem to be missing one or more of the above mentioned parts.

  • CKAN maintained by the Open Knowledge Foundation uses most of DCAT and doesn’t describe dimensions.
  • Dataverse created by Harvard University uses a custom vocabulary and doesn’t describe dimensions.
  • CIARD RING uses full DCAT AP with some extended properties (protocol, data type) and local taxonomies with URIs mapped when possible to authorities.
  • OpenAIRE, DataCite (using re3data to search repositories) and Dryad use their own vocabularies.

The solution to these existing issues seem to be in general, introducing custom vocabularies.

References:

Introduction to Semantic Web

Hitchhiker’s guide to the Semantic Web

What? There is more to the web than what we know? But why? What is semantic web? Why do we need it? How does it look like? How do we use it? Where is this applicable? What does linked data got to do with it? Is this the future of web?

I was invited in March 2015 at the Women Techmakers Istanbul event where I got to hold an introduction about Semantic Web.


“The Semantic Web is an extension of the current web in which information is given well-defined meaning, better enabling computers and people to work in cooperation.”  Tim Berners-Lee [1]

————

[1] The Semantic Web by Tim Berners-Lee, James Hendler, and Ora Lassila, Scientific American, 2001