Today is my last day at my Project Assistent job at Vienna University of Technology. I did some summing up of my work and polished the TwitterAPI and also the Data Statistics View code. I want to share my implemnetation of the Data Statistics View code. This was done with html, php, javascript and SQL. The project can be used for any data types stored in a SQL database.
One of my tasks at university was to download data from the Twitter public stream and analyse it. This work was easier with a tool that allows visualizing the number of downloads per hour/day/month.
The API I used to download tweets is the one based on Adam Green’s implementation called 140dev. He also has a visualizing tool for the downloaded tweets. However this has less to do with numbers rather much more with the tweet texts.
The code for my implementation can be found on my GitHub repository.
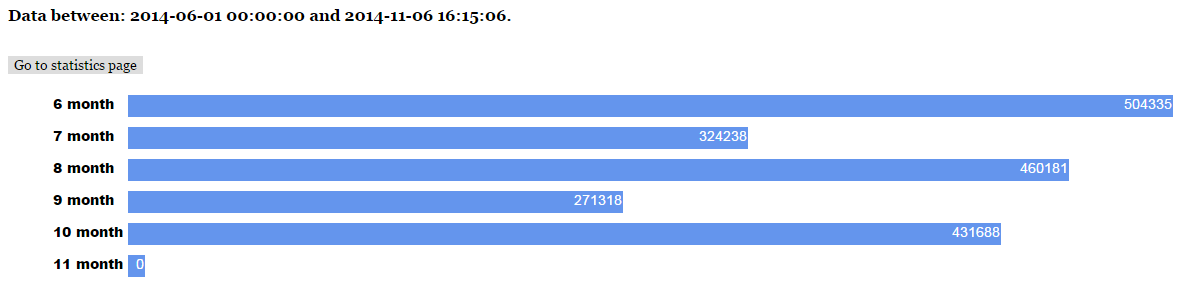
It contains simple bar charts of the number of tweets downloaded.
Working with the Twitter public stream I navigated a lot of questions which I found or did not find answeres to:
- How can one download tweets only for a specific country?
- When is the rate limit reached?
- If the rate limit is reached how loang do I have to wait until I can download again?
- Why do some Twitter user accounts work and some do not?
And so on…
My time at university was only one part about these and the rest I will probably tell in another post.